downtoearth: Visualize astronomical scales by using geographical intuition
Jan 08, 24TL;DR – I made a tool for visualizing large-scale stuff by using geographical intuition. Check it out now or read more about it below.
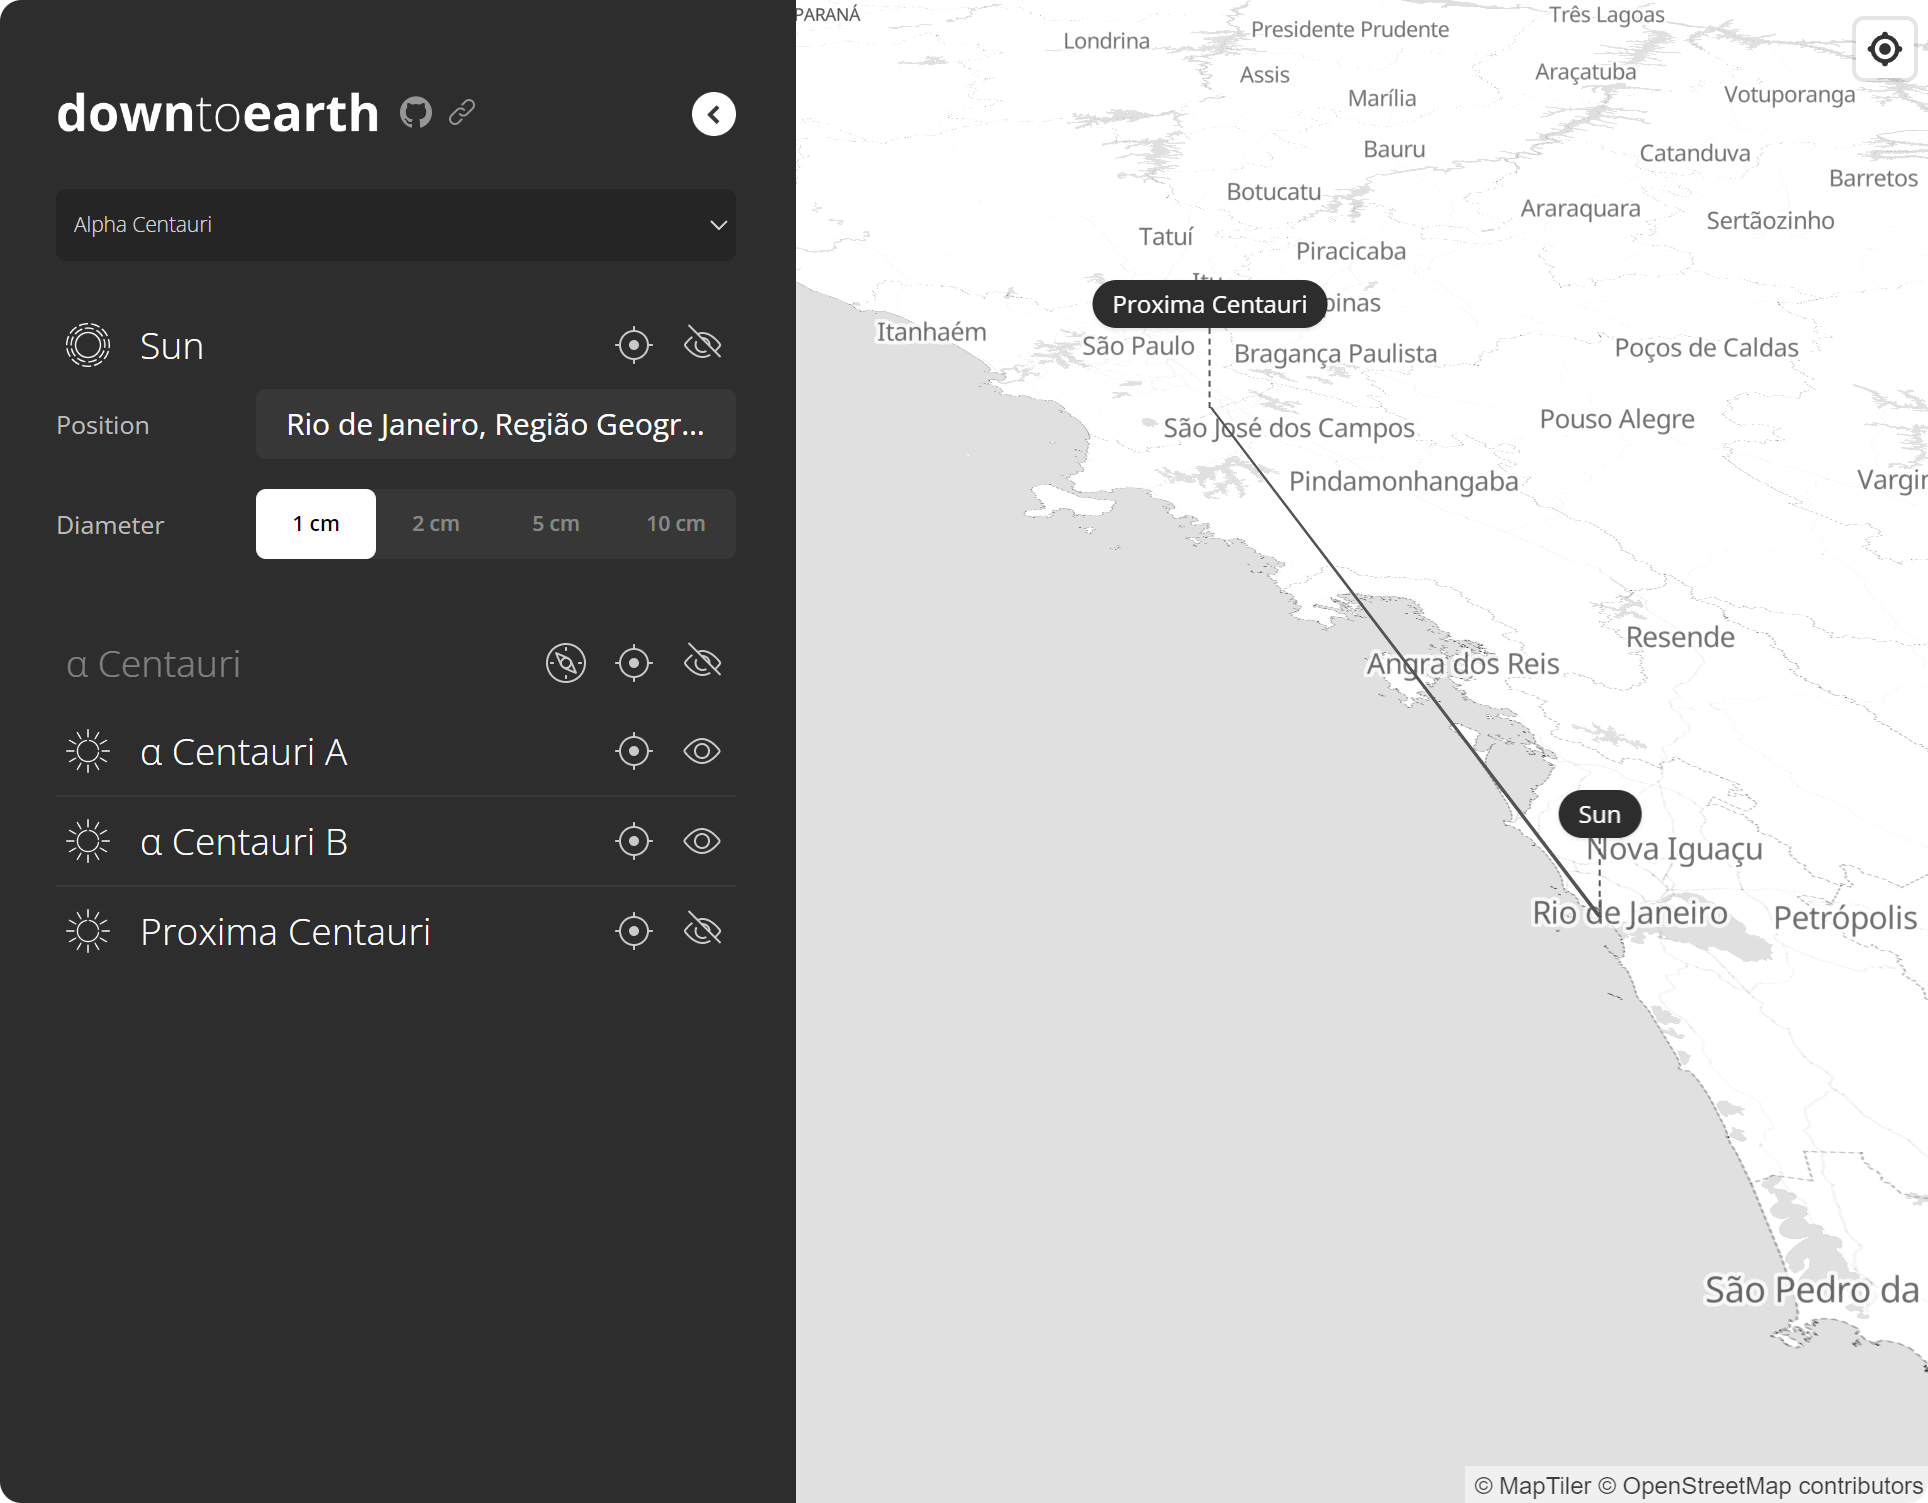
If we scaled down the universe until the Sun’s diameter was 1 cm, what would be the distance to the nearest star?
One day this thought popped in my head while reading about astronomy and reflecting on the unfathomable scale of the universe. Where, indeed, would the nearest star be? A few hundred meters away? Maybe a kilometer or two?
As it turns out, in a scaled universe where the Sun is a mere 1 cm in diameter, our closest star neighbor – Proxima Centauri – would be approximately 288 km away. “Hell”, I thought, “if this tiny Sun was located in my living room in Rio de Janeiro, Proxima Centauri would be almost as far as São Paulo!”
Certainly I cannot wrap my head around the distance of 4.2 light-years, or 40 trillion kilometers, but I do have an intuitive understanding of the Rio-São Paulo distance. I was born and raised in Rio. I have seen both Rio and São Paulo represented on a map countless times, from geography classes at school, to weatherman reports on TV and the routine usage of Google Maps. I have personally visited São Paulo quite a few times since a young age, treading the distance by car, bus, and plane.
So there it was, in the context of such mundane path, the sheer enormity of our universe. For a brief moment, I could visualize a tiny 1 cm Sun floating in front of me in the darkness, and far away – so far away – Proxima Centauri, our closest neighbor. All in a somewhat comprehensible scale of distance.
And thus the concept of downtoearth was born: scale down the universe, plot it on a map of the Earth, and get better intuition for astronomical scales from local geographical knowledge.
Visualization tool
The Rio-São Paulo distance insight only works for those who know this distance by heart. If you live in Jacarta or Oslo, my personal insight can be as easily visualized as the unfathomable 40 trillion km figure. In order for this type of visualization to work for any person, it would have to be tailor-made for individual localities and scales.
That’s how downtoearth turned into a software project. By creating a simple website where you could choose a custom position for the visualization, anyone could develop the same kind of intuition.
Why stop at this one visualization, though? Other than the vast distances to the nearest star systems, there are several potential astronomical visualizations to be made. The Solar System and its planets, Earth’s satellites, exoplanets, galaxies and so many other systems and scales can be visualized – and better understood – from a local geography viewpoint.
Here are a few examples. You can try them out by going to the downtoearth page and selecting the appropriate visualization in the dropdown menu, while changing location by using the Position input or clicking anywhere on the map itself.
The Solar System
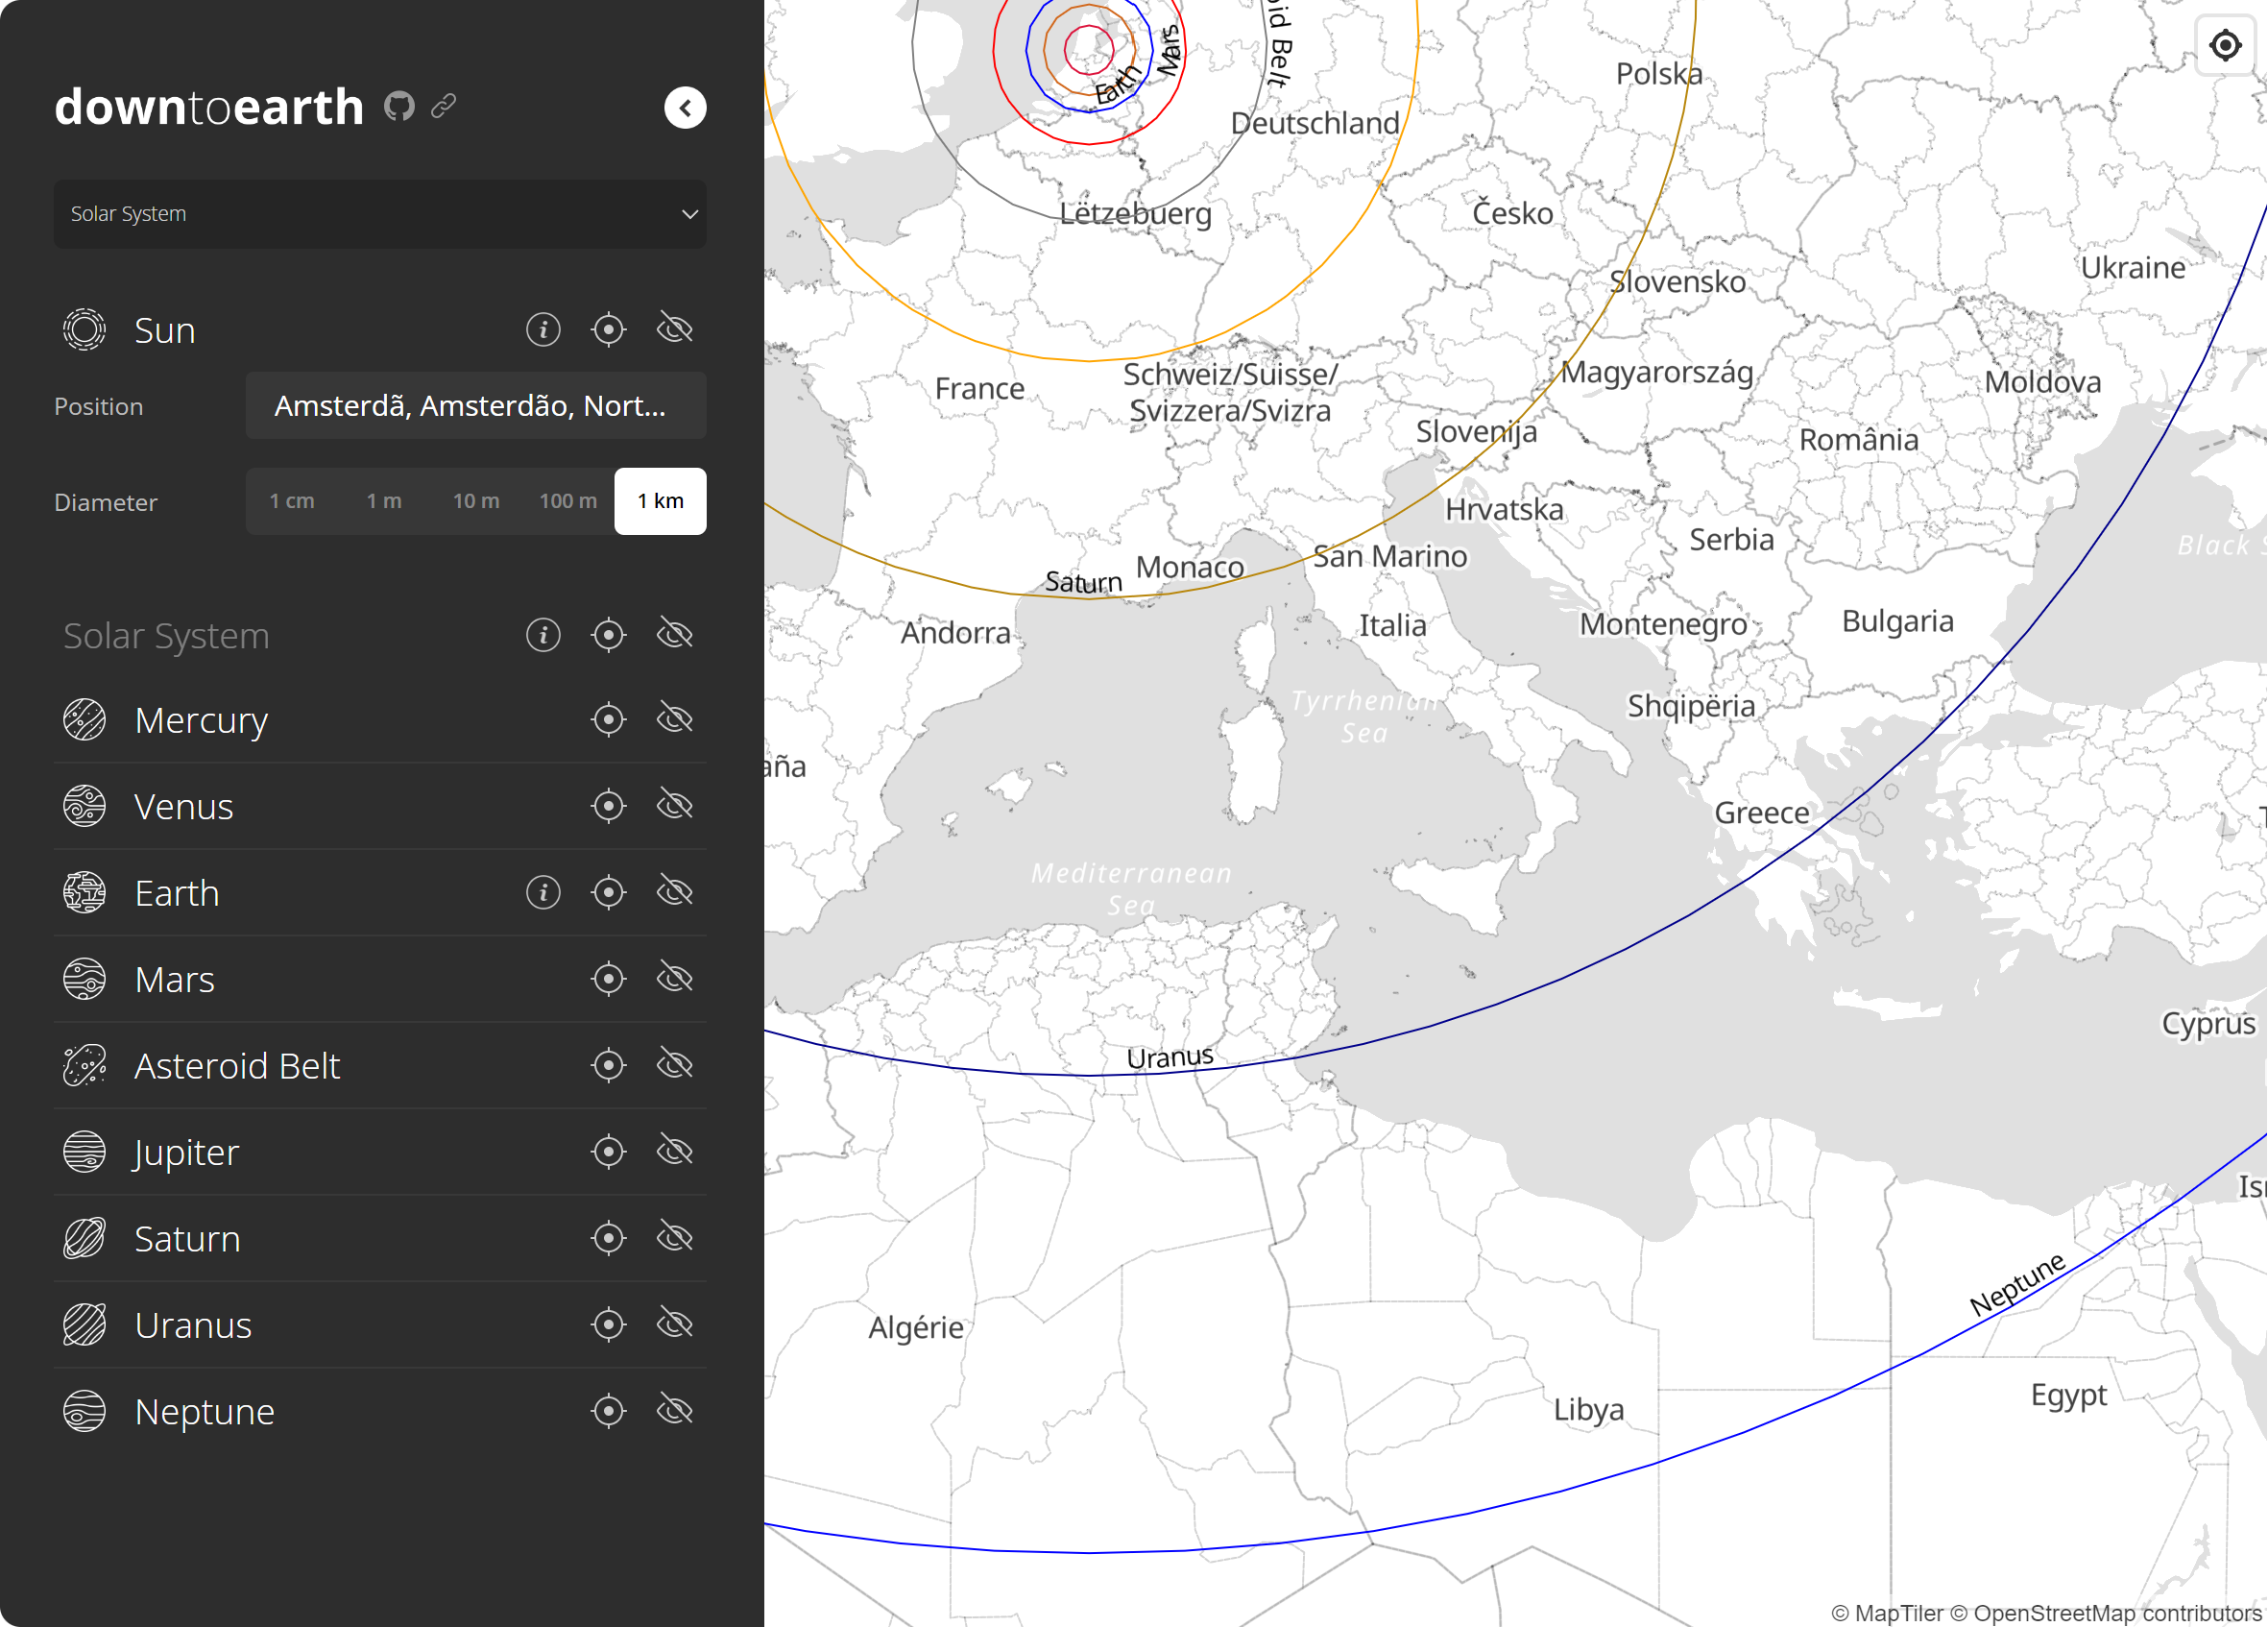
If the Sun was 1 km in diameter and positioned in central Amsterdam…
…Earth’s orbit would still be essentially inside the Netherlands, while Mars would reach Belgium and Germany, Saturn would reach as far down as northern Italy, Uranus would reach Algeria, Tunisia and Greece, and Neptune would reach all the way to Libya and Egypt.
In this visualization, it’s easy to see that the spacing between planets seem to follow some kind of power-law – each planet seems to be roughly twice as far from the Sun as the previous one (something often referred to as Titius–Bode law), at least until Neptune. In this way, each planet’s orbit seem to reach increasingly distant regions of the map.
James Webb Space Telescope (JWST)
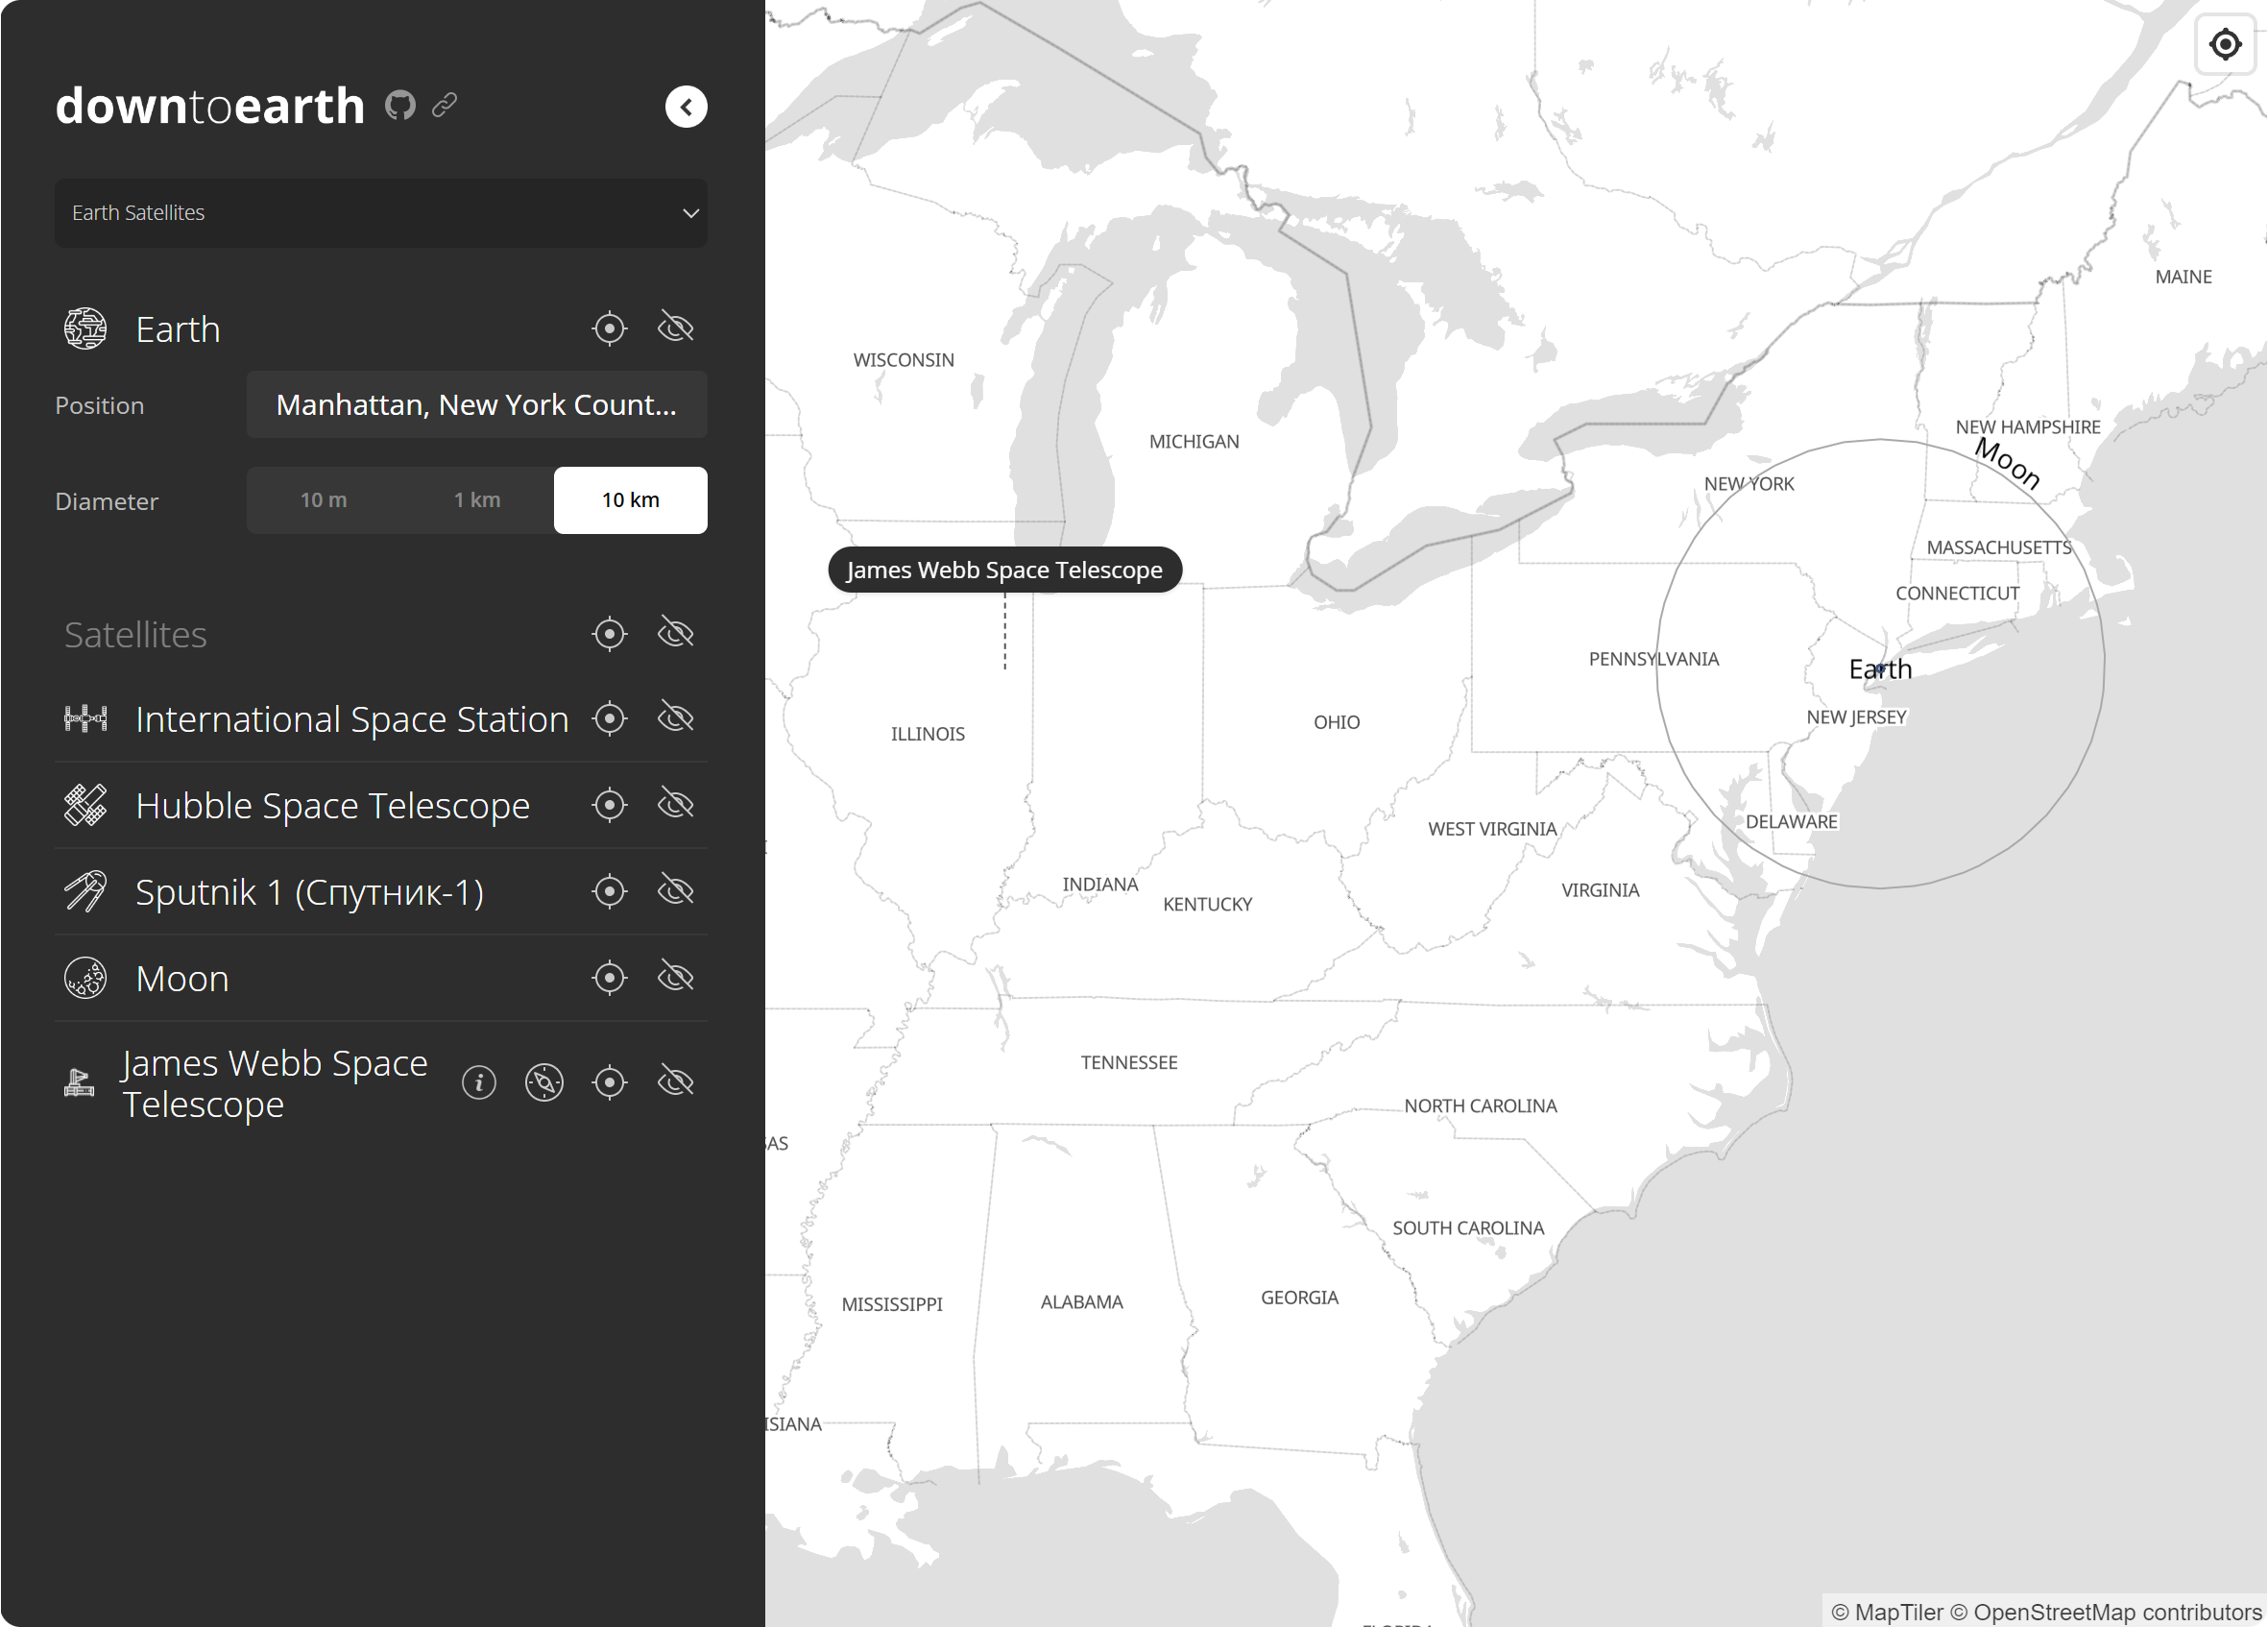
If Earth was a 10 km wide orb engulfing a good chunk of Manhattan…
…the Moon’s orbit would reach the middle point of Pennsylvania, while the James Webb Space Telescope would be all the way out in Illinois, distance-wise.
That’s because the JWST is actually orbiting the Sun in the so-called L₂ Lagrange point of the Earth-Sun system, 1.5 million kilometers away from our planet (in opposite direction to our sun), much more distant than the Moon’s orbit. This is a naturally perfect spot to park your high-resolution, high-sensitivity infrared space telescope.
Whatever else you want to visualize
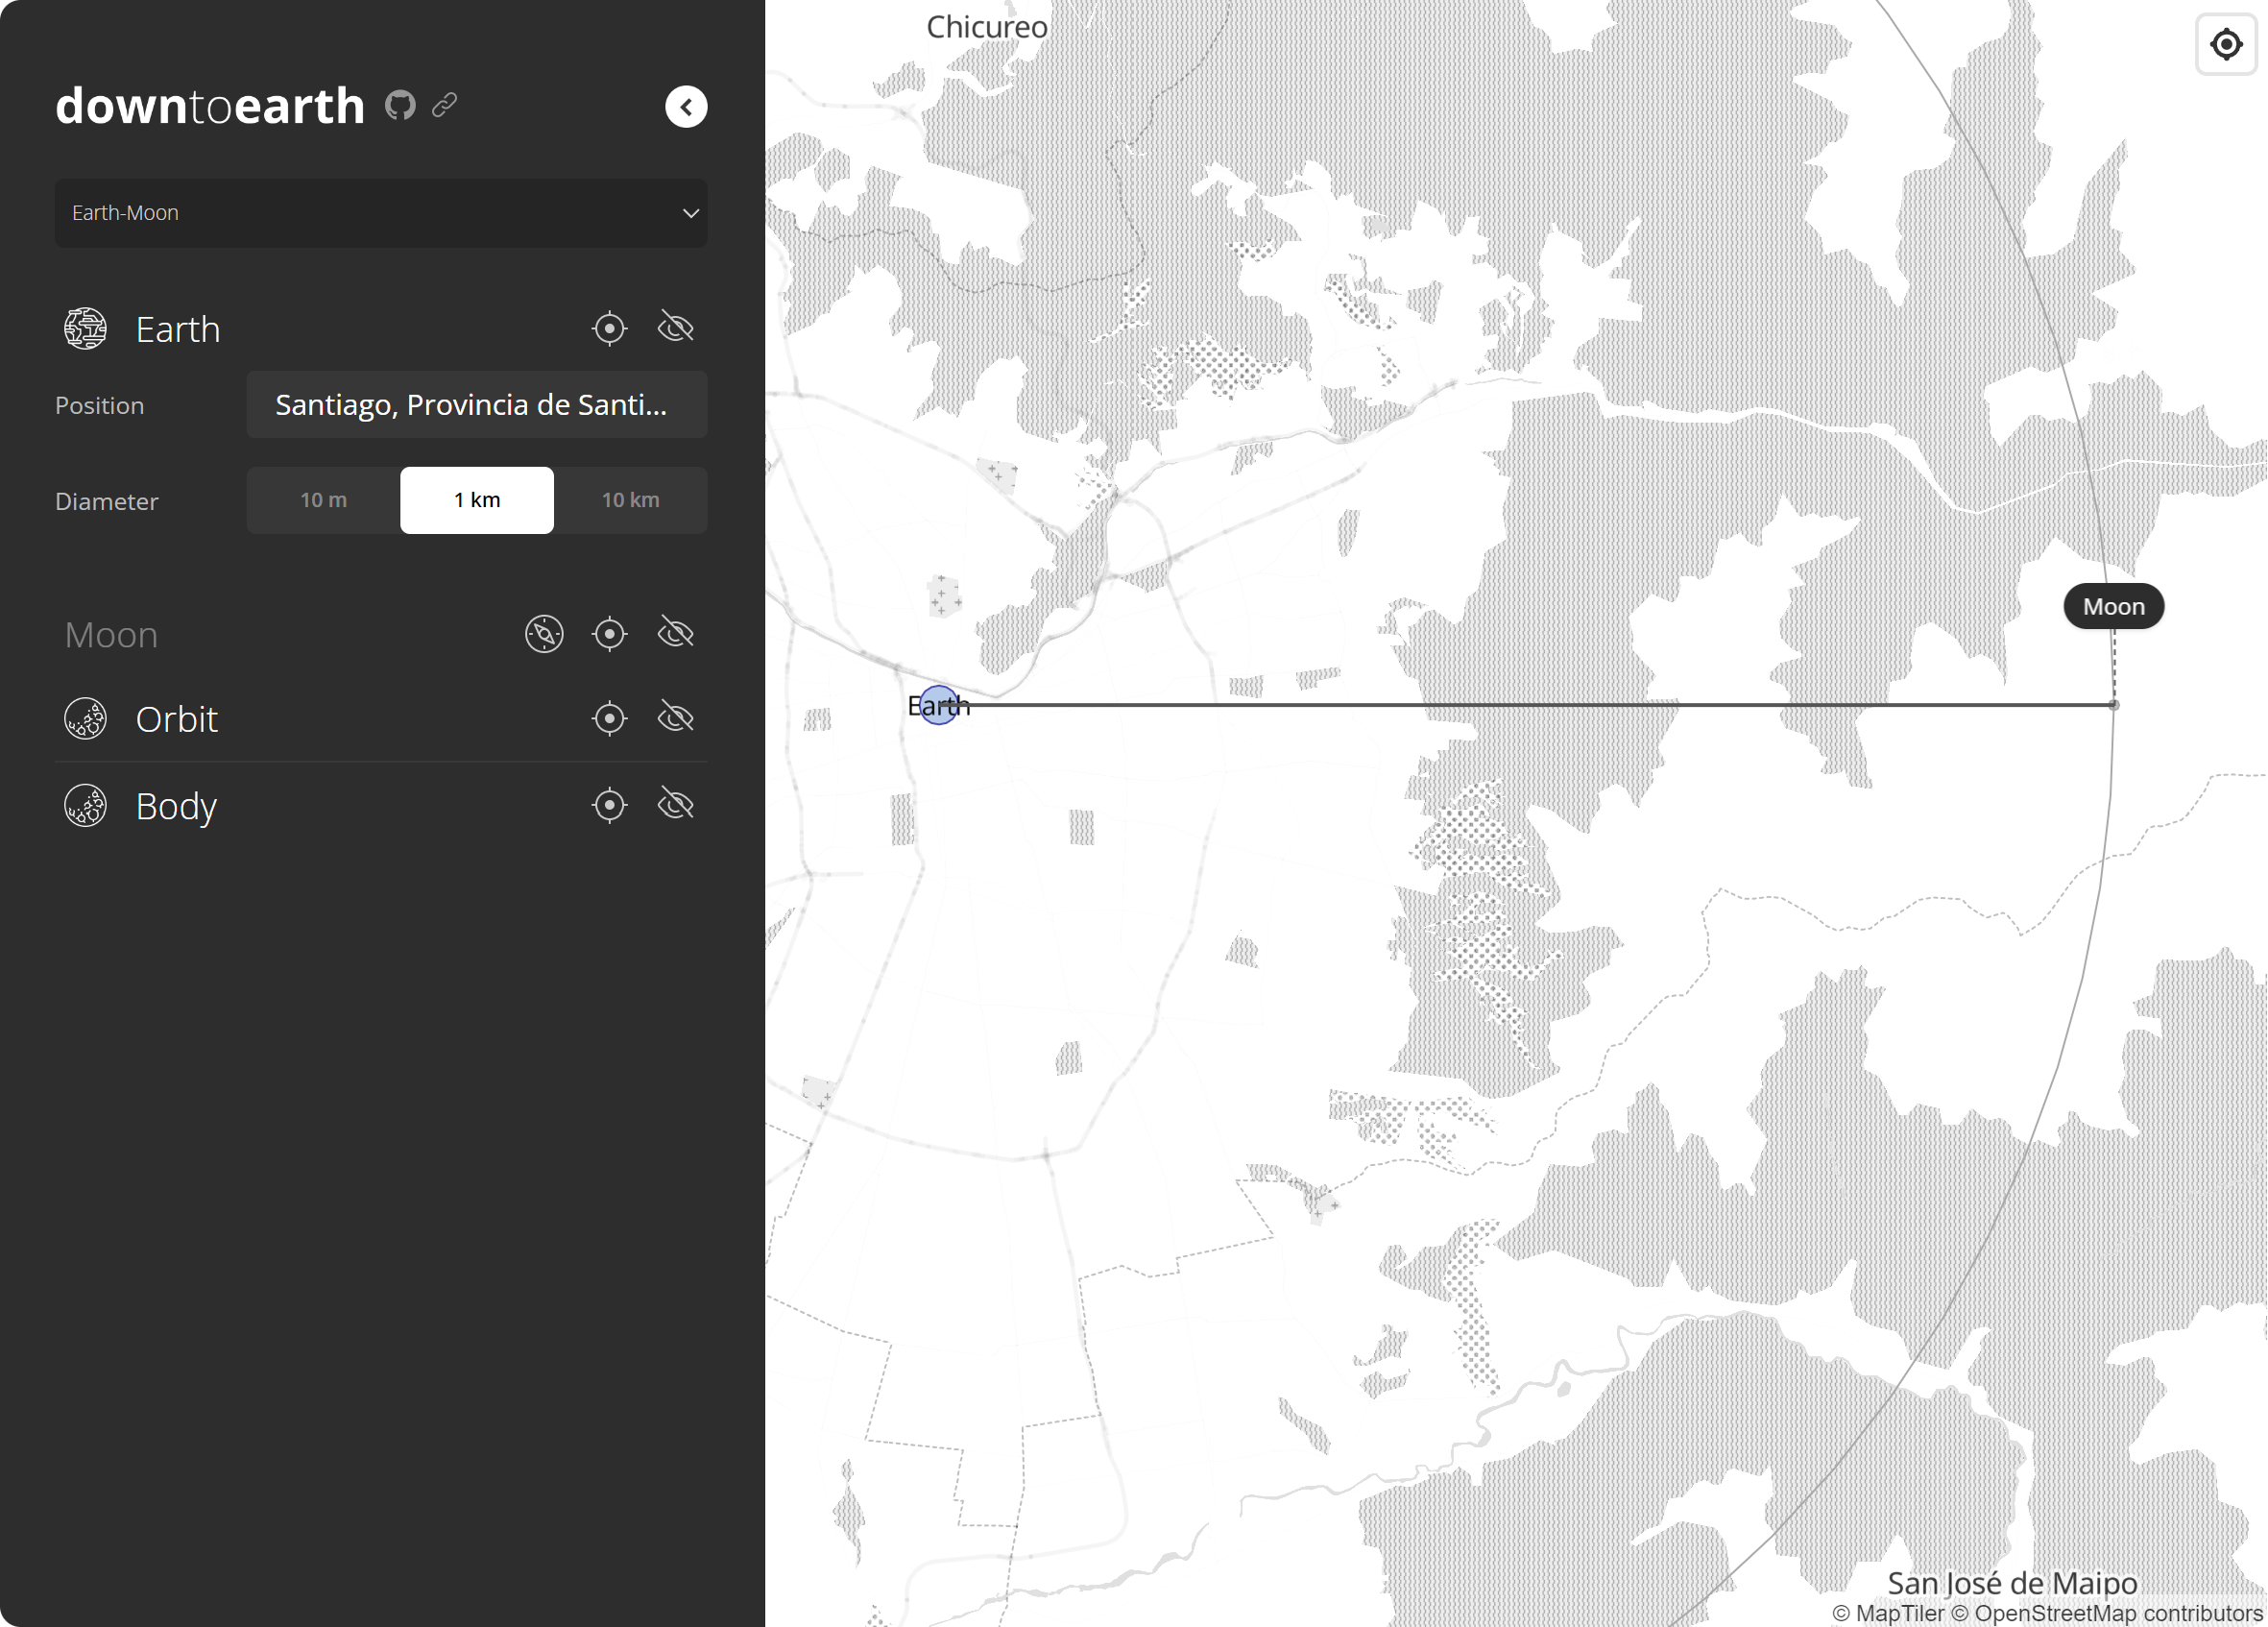
As there is such a great number of visualization that could be made, astronomical or otherwise, downtoearth shouldn’t have only a few fixed visualizations. That’s why it was actually developed around a purpose-built JSON schema.
A custom visualization can be loaded by using the From file... option on the dropdown menu. It can also be shared by using the link button next to the logo.
Here is a simple example for the Earth-Moon system.
{
  "title": "Earth-Moon",
  "root": {
    "icon": "earth",
    "label": "Earth",
    "size": 12742,
    "features": [
      {
        "shape": "circle",
        "label": { "value": "Earth", "position": "center" },
        "fill": { "color": "#6b93d6", "opacity": 0.5 },
        "outline": { "color": "#4f4cb0" }
      }
    ],
    "sizePresets": [
      { "label": "10 m", "km": 0.01 },
      { "label": "1 km", "km": 1, "default": true },
      { "label": "10 km", "km": 10 }
    ]
  },
  "models": [
    {
      "label": "Moon",
      "bearingControl": true,
      "bearing": 90,
      "models": [
        {
          "label": "Orbit",
          "size": 769496,
          "icon": "moon",
          "features": [
            {
              "shape": "circle",
              "outline": { "color": "darkgray" }
            }
          ]
        },
        {
          "label": "Body",
          "size": 3474.8,
          "icon": "moon",
          "popup": { "content": "Moon" },
          "features": [
            {
              "shape": "circle",
              "fill": { "color": "gray" },
              "outline": { "color": "darkgray" },
              "offset": 384748,
              "drawLineToRoot": true
            }
          ]
        }
      ]
    }
  ]
}
For more information about the schema and the project in general, as well as reporting issues or making contributions, please head over to the GitHub repo.